Pictal Health – Health history visualization service & product
My own startup: Pictal Health • 2018-present • Role: Founder, UX research & design, product & business strategy
Challenge
As an autoimmune patient, I experienced how hard it was to explain my complex history to my doctors. After dabbling with visual health timelines and symptom drawings for many years, I started Pictal Health, a company to help other complex patients visualize their health history and communicate better with their healthcare providers.
Goal: create a viable health history visualization service, product, and business
Below are activities I undertook in an effort to design a user-centered process and product while creating a product strategy and business model.
What follows is more of a startup case study than purely a design case study; but you’ll see how my design background and penchant for visualizing information helped me along the way.
Team
Along this journey I have often worked alone with advice and mentoring from untold friends and associates. I have also collaborated more extensively with developer Chris Zamierowski, health data expert Sally Buta, health commercialization expert Anne Miller, designer Alli Berry, and tech procurement expert Ron Herman.
Part 1: The Service
Starting up: user research, brand, prototyping a ‘service’
Patient and clinician interviews
As a designer, I know that the best products and services are grounded in user research. To kick off, I interviewed 15 patients and caregivers and 10 healthcare providers (doctors and nurses). For patients and caregivers, I wanted to know how they communicate with their care team: what works and doesn’t work, what is frustrating, how they keep track of what is happening with them, etc.
I focused on patients with complex health problems and those who were trying to get a diagnosis. For healthcare providers, I wanted to understand their thought process: how they approach the diagnostic process, how they manage time during patient visits, what their pain points are, and what they would improve.
Distillation & modeling findings
I organized findings using an affinity diagram:

A few key findings:
Patients “start over” at each new doctor they see. It’s frustrating. They’re forced to repeat tests, treatments and medications.
Patients are forced to tell their story over and over to different care team members — it’s tedious.
It’s hard for patients to remember and convey the timeline of their health history.
I wrote up and ‘open sourced’ all of these design research findings here.
Brand and website development
I worked with designer Alli Berry to develop a brand system: colors, logo, typography, illustration style, social media icons and banners, business cards, and more. Here is a smattering of brand elements:

We styled the Pictal Health website, and to ensure we were speaking to our intended audience (complex patients), I pulled words and concepts straight from my user research findings:

And indeed, I have heard from complex patients that the website perfectly describes their situation.
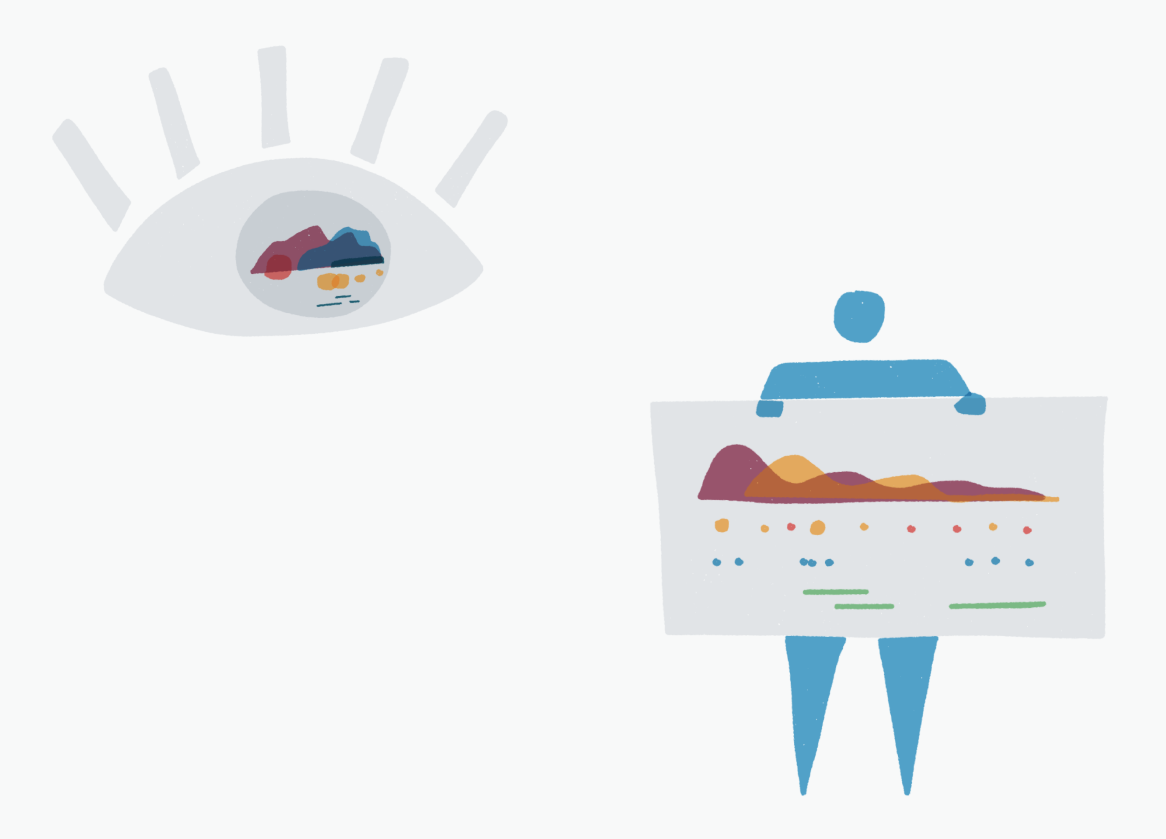
I created all illustrations. I intended them to have an overlapping, almost prismatic quality, a nod to the overlapping nature of a health history (how stress overlaps with symptoms, etc.)
Prototyping a health history visualization service with 70+ clients
Very early on in this journey, I started helping friends visualize their health history. I had some early successes: the first person I worked with, Dave, was able to get a diagnosis after decades of struggle. I wrote up a case study about his experience called Blood and Barbed Wire that had over 10k views on Medium and resonated with readers.
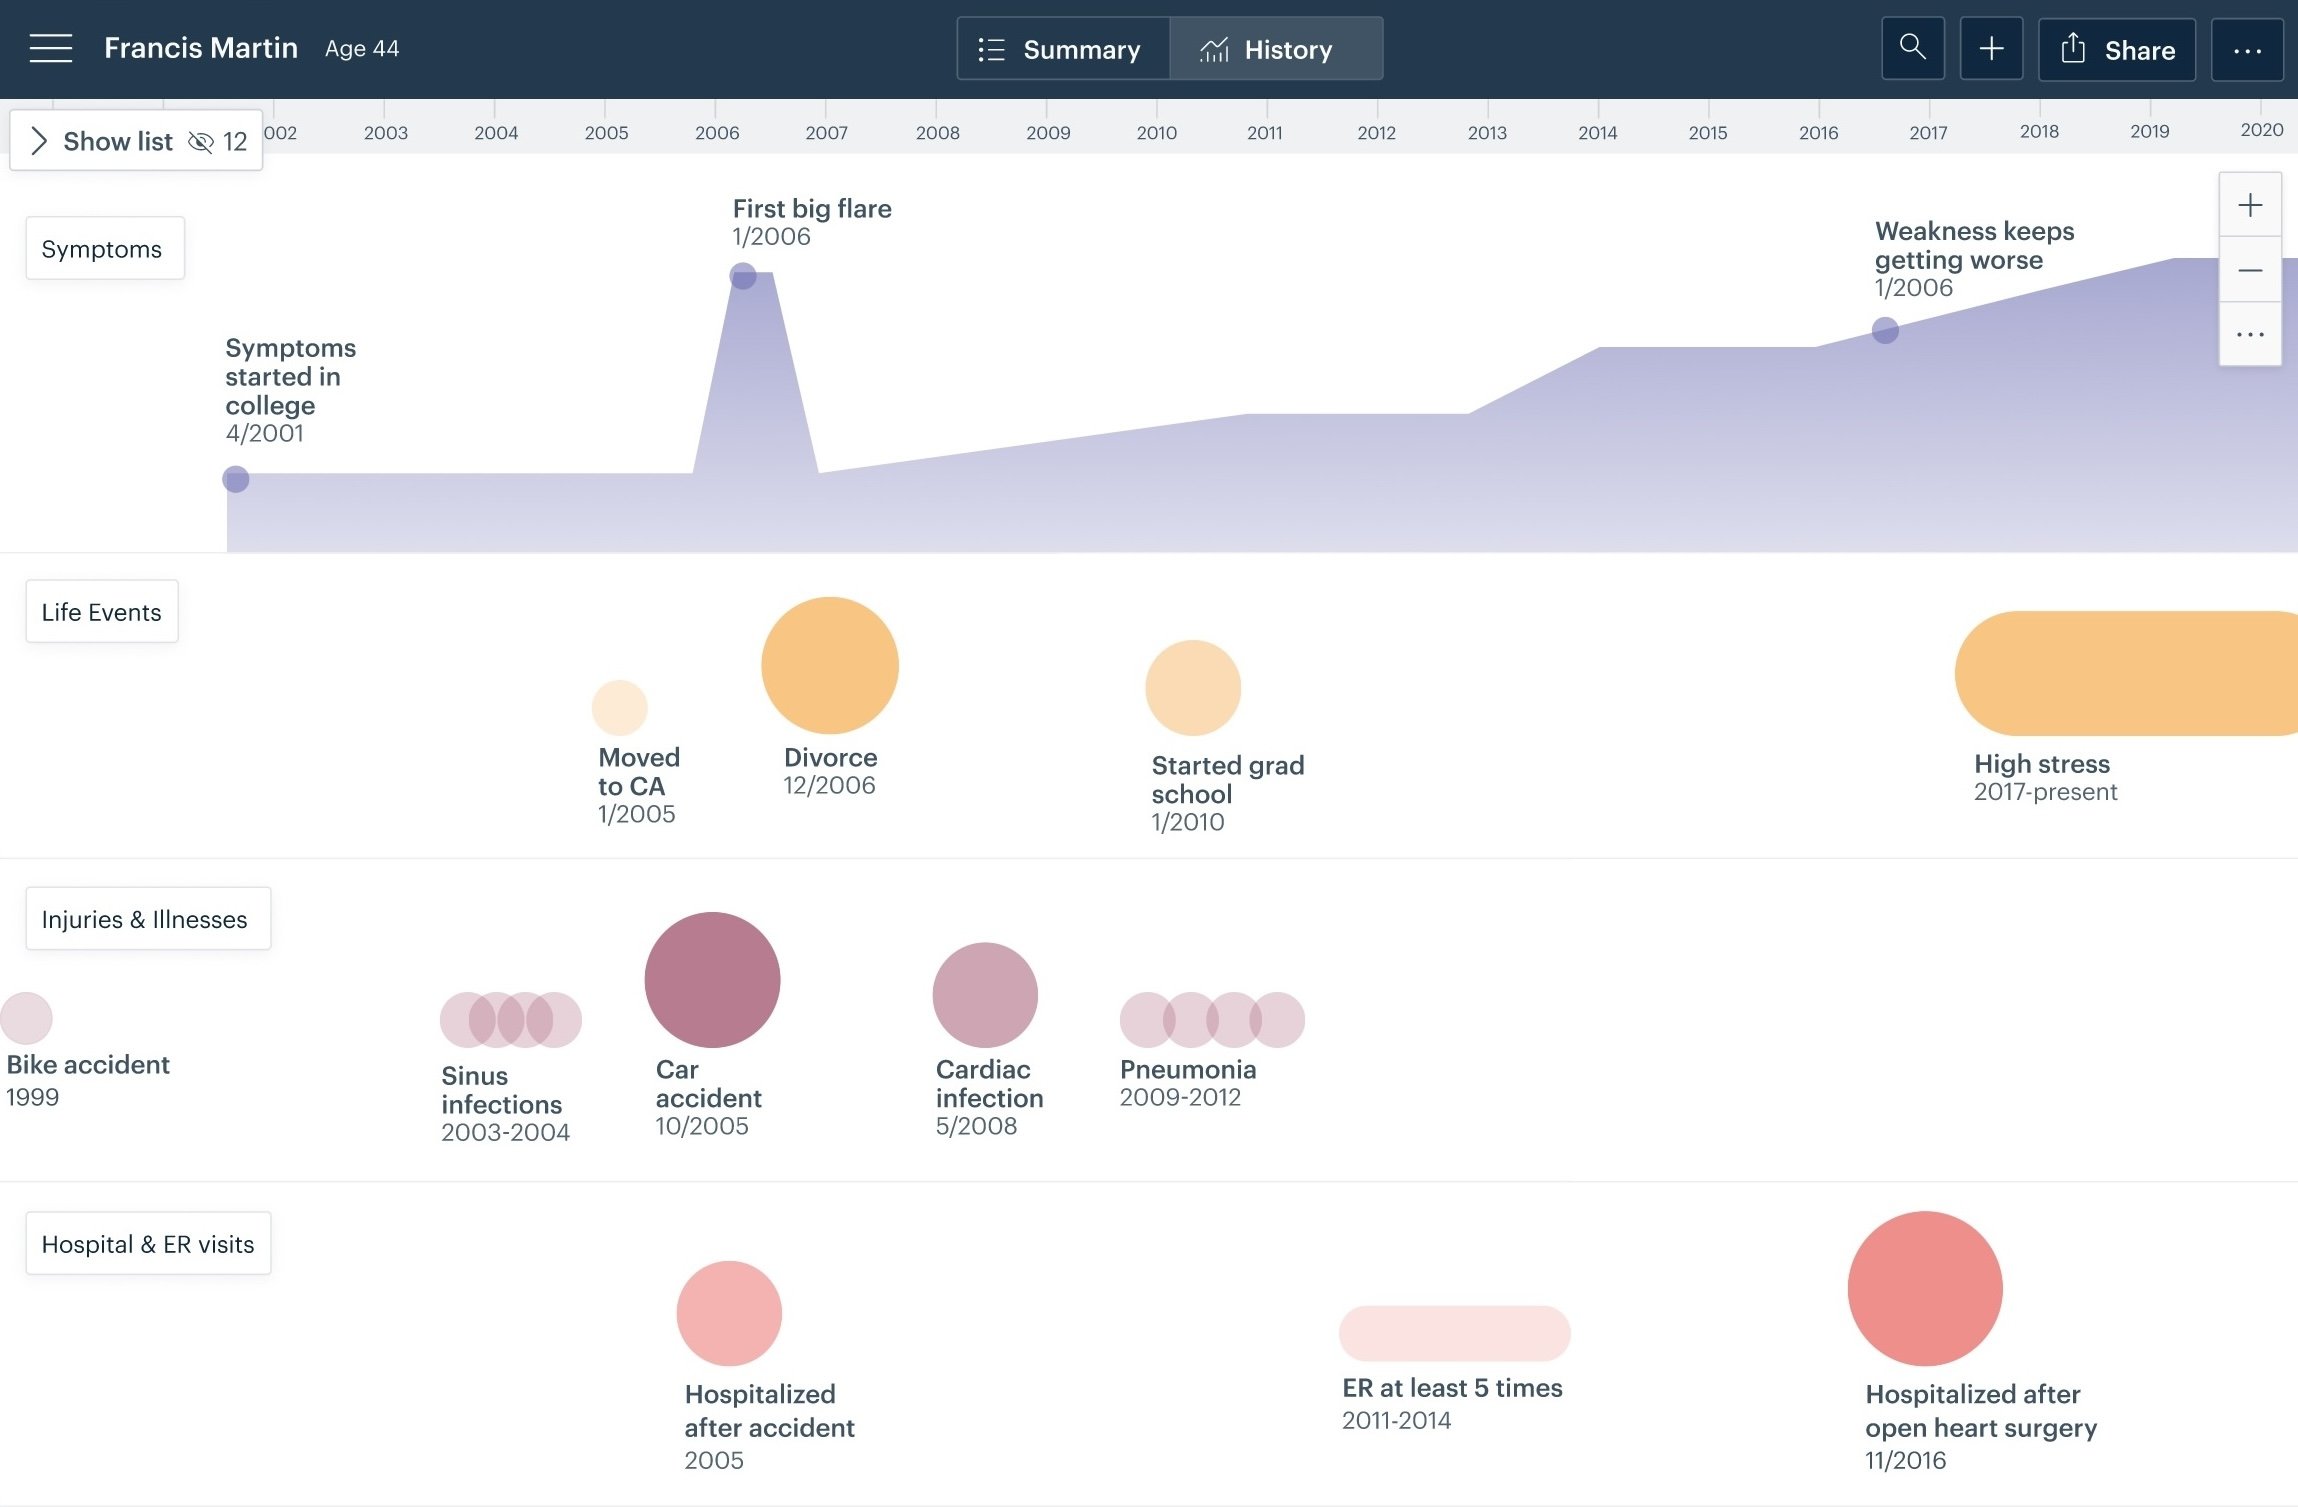
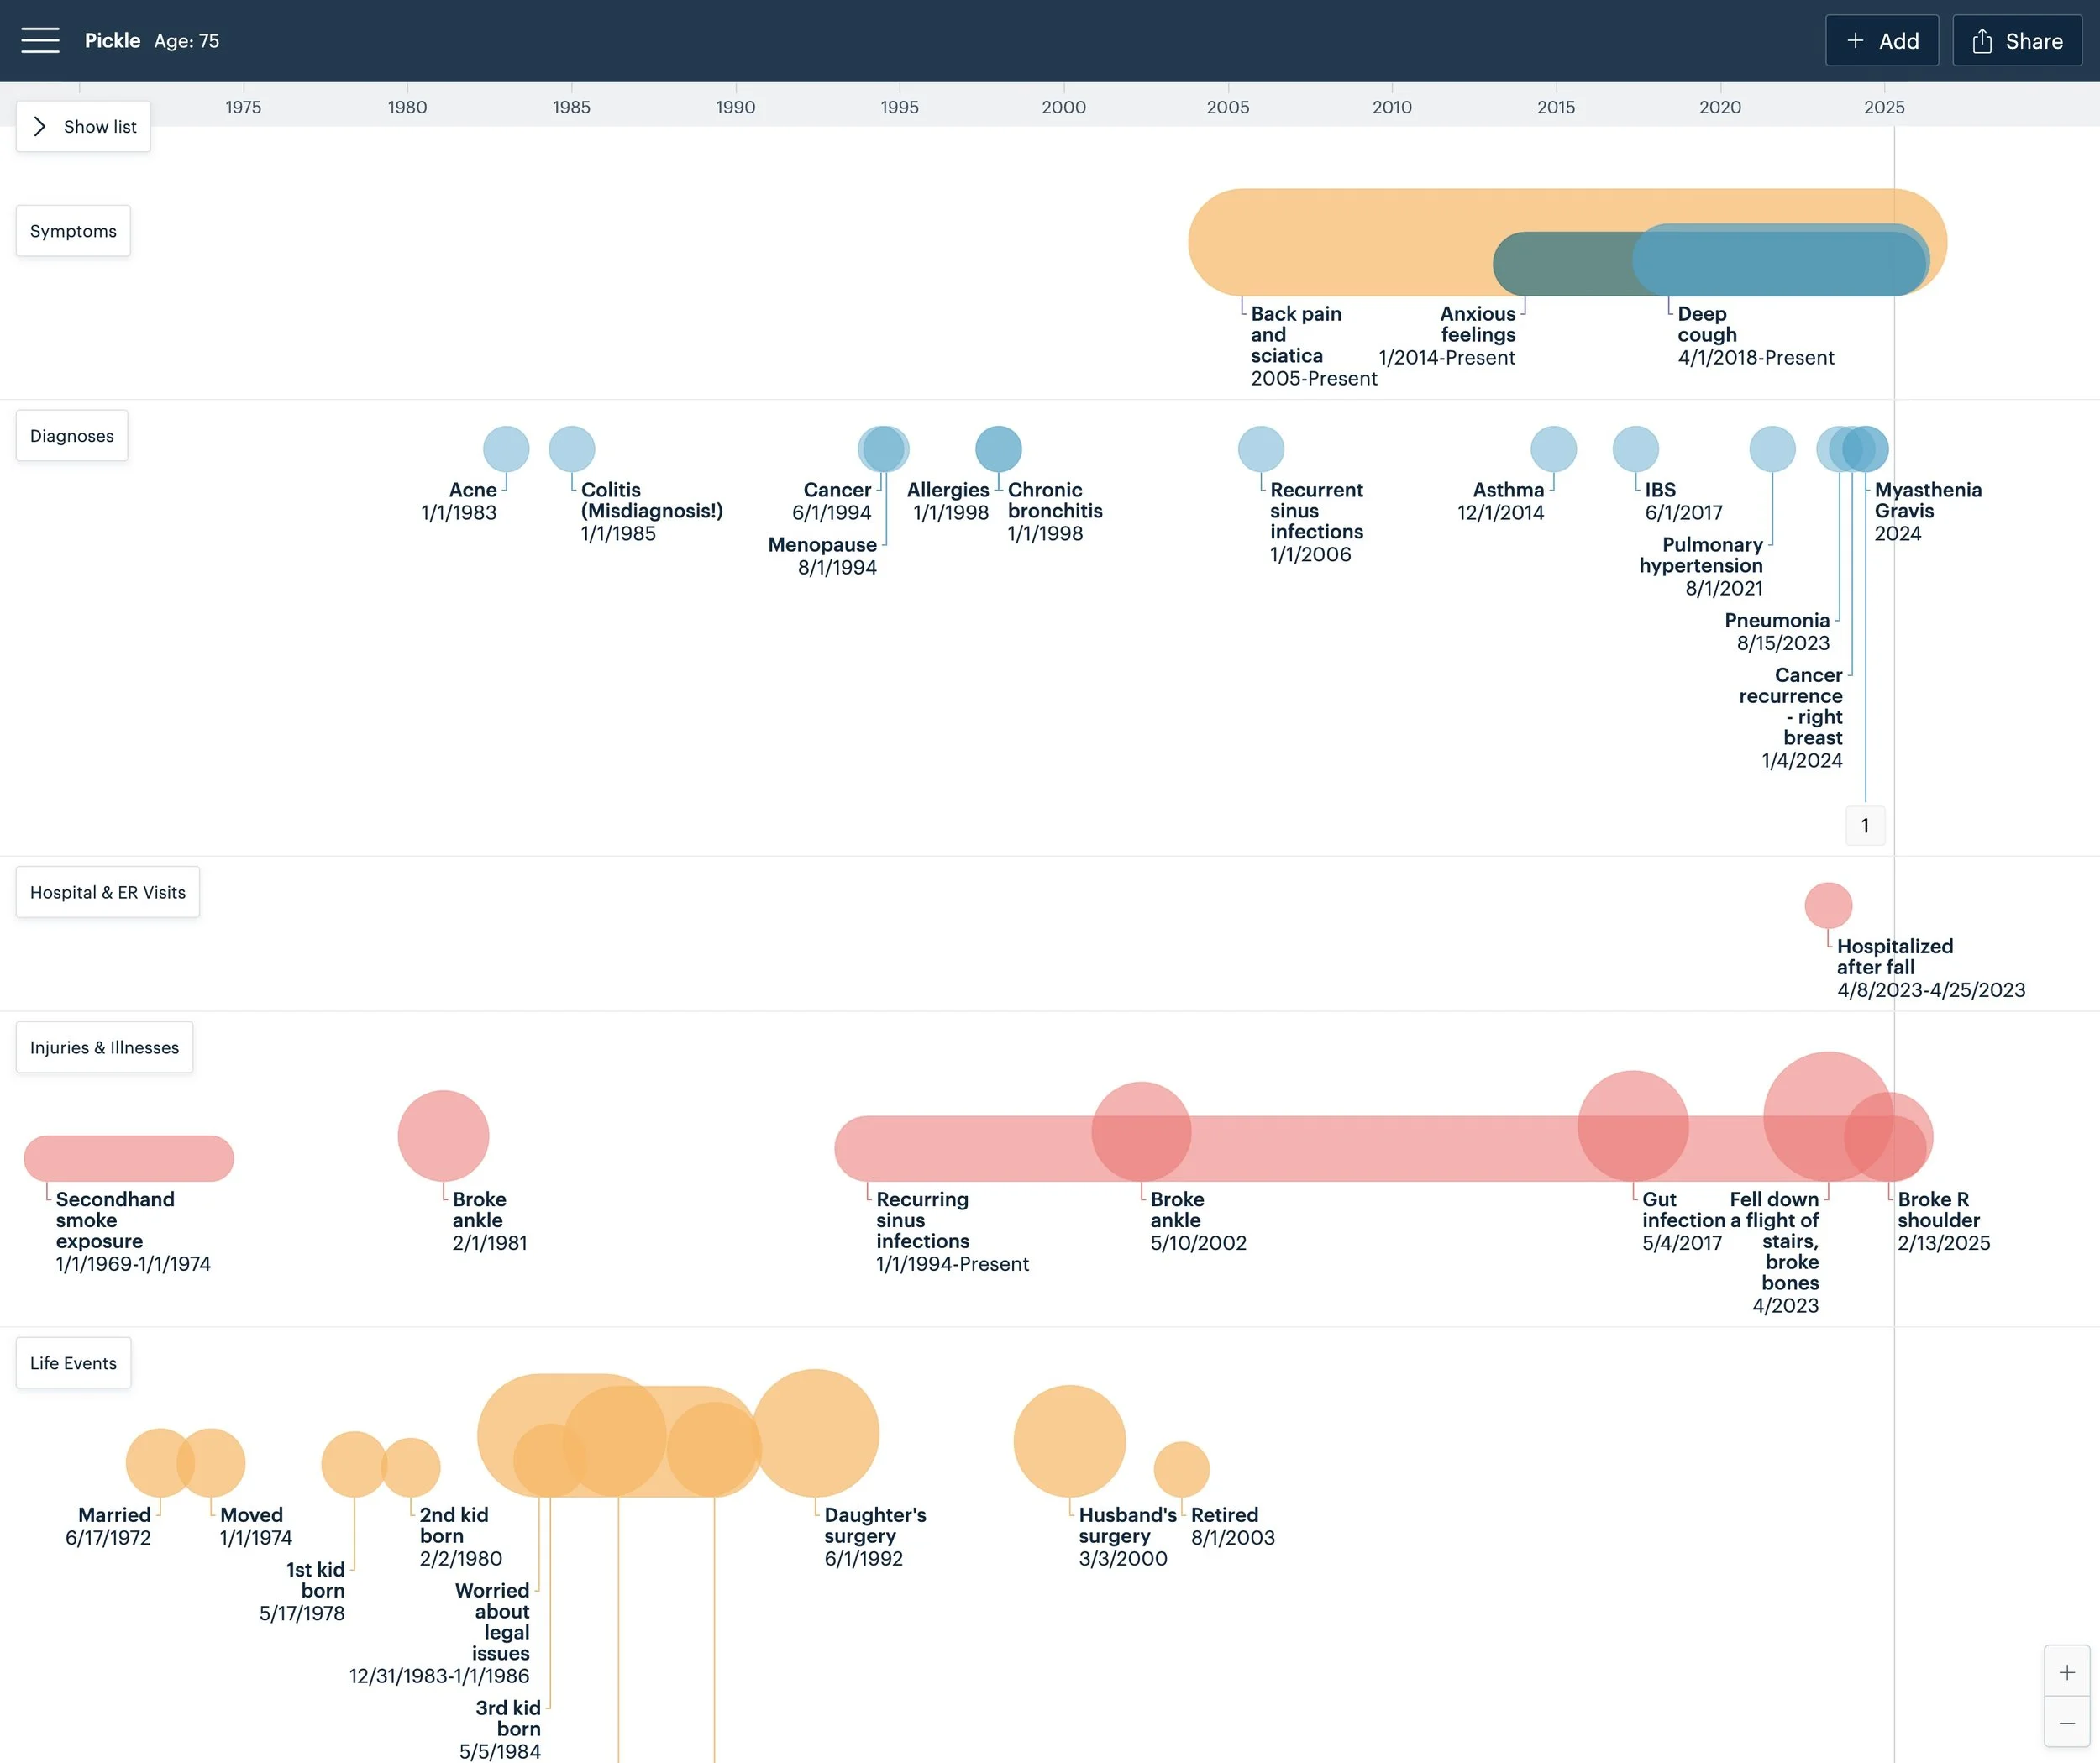
After working with Dave, I helped over 70 other clients (over half of them paying) through a manual process in which I interviewed them, created visuals for their story, and prepped them to use these in their next doctor appointment. I learned a lot along the way, and used these insights to feed into the more scalable product. Here is a sample health history timeline that I have permission to share:
10-patient pilot with the VA
During the summer of 2019, I worked with 10 Vermont-based veterans and a psychiatrist through a pilot project with the VA. I wrote up some key things I learned in this post:
How visual health histories can help military veterans
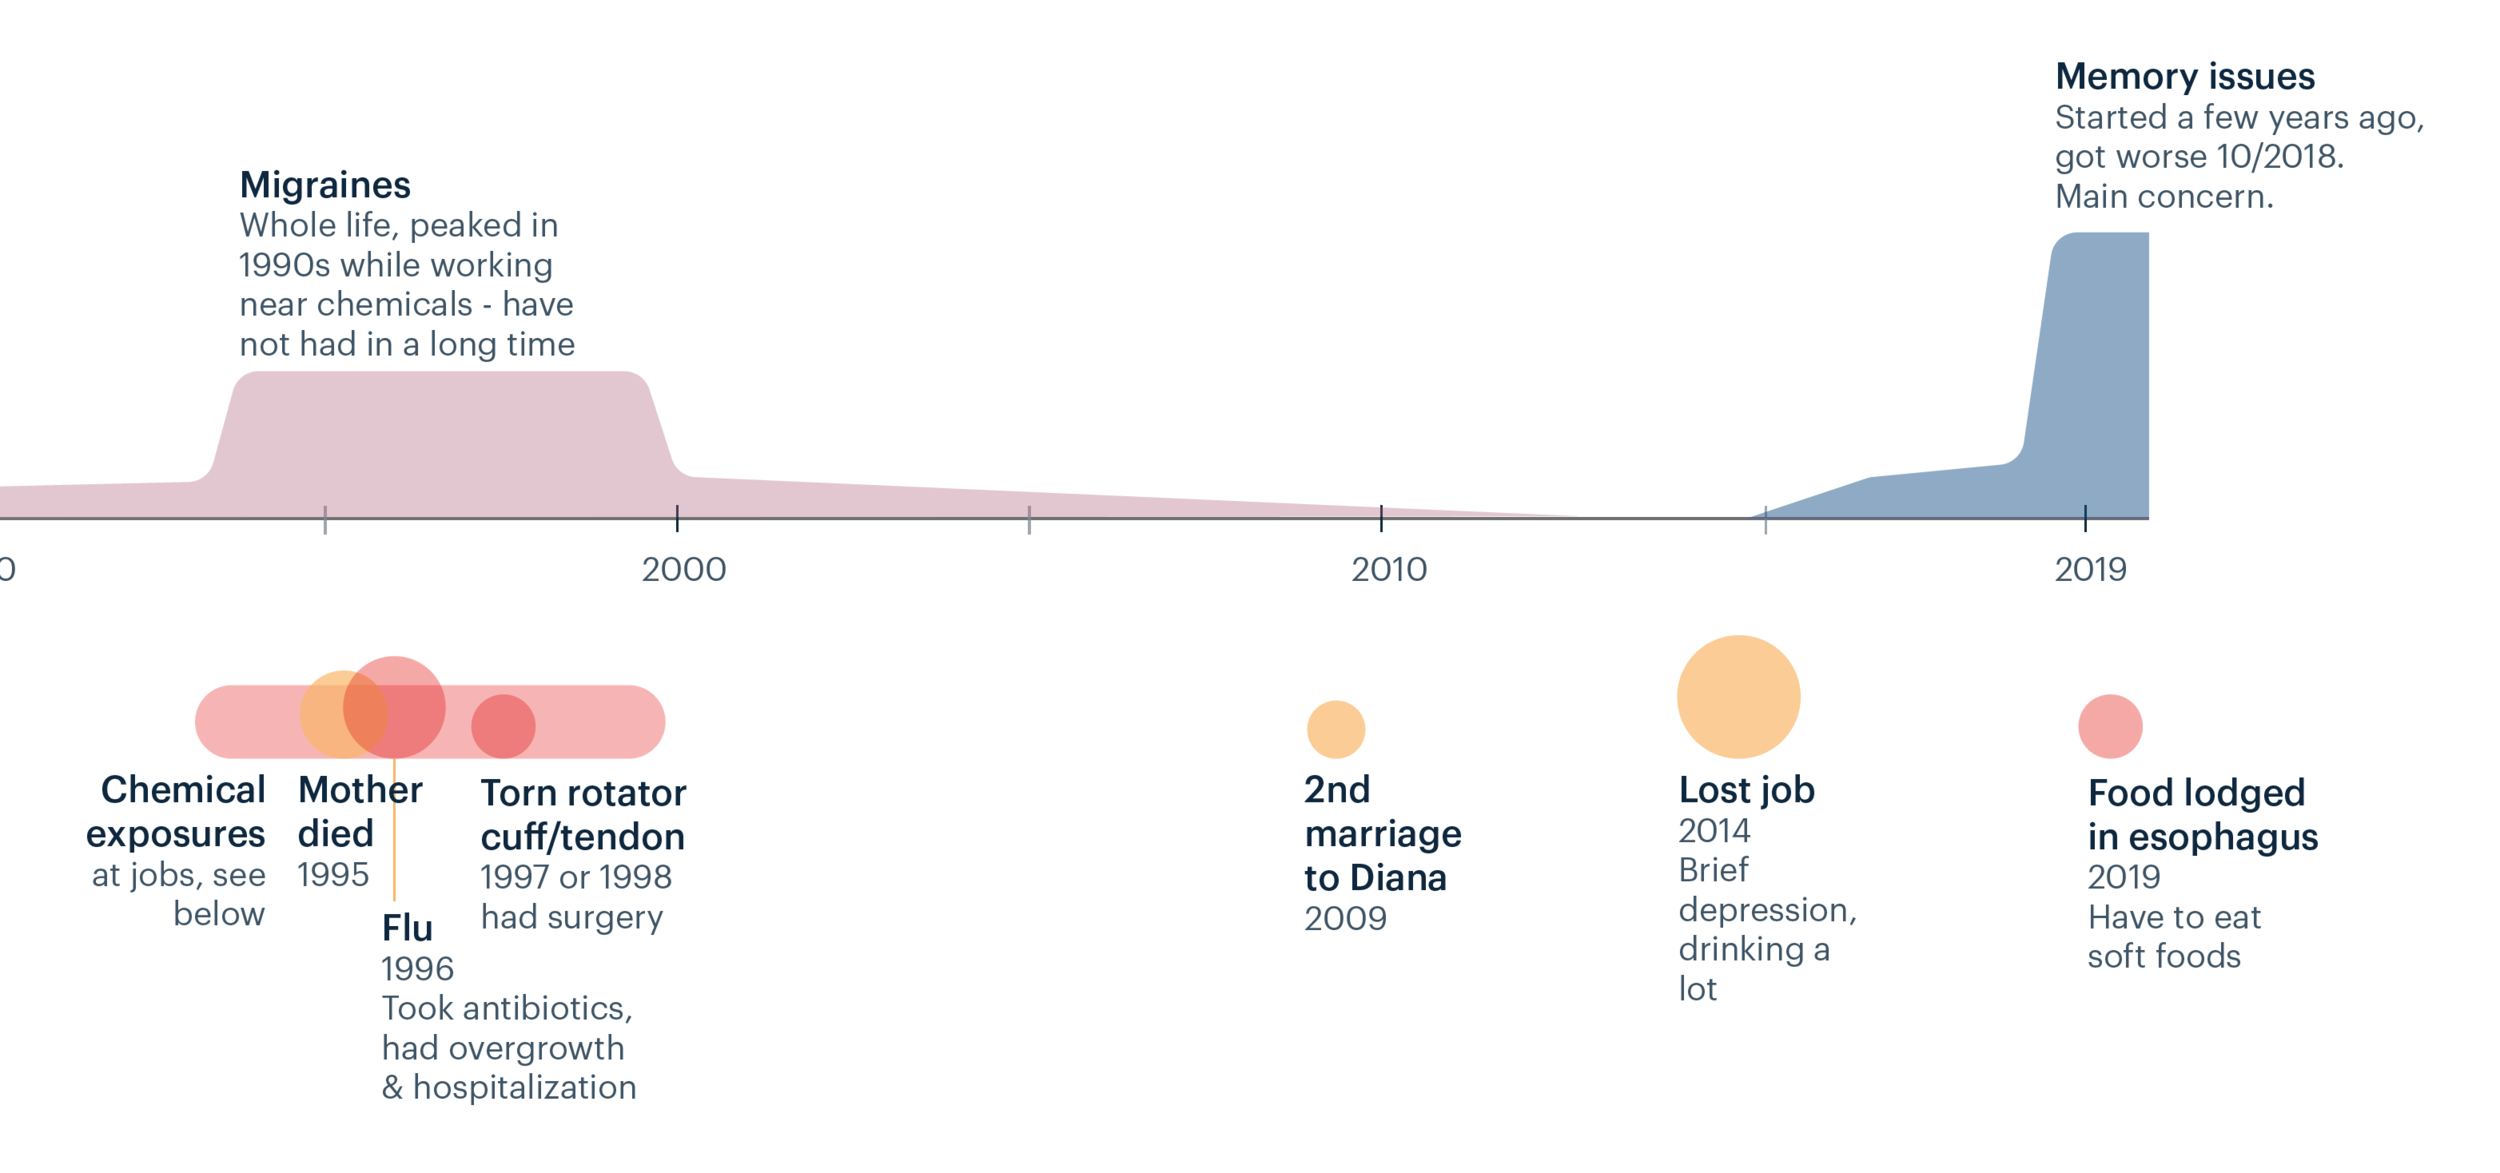
A small excerpt of one veteran’s timeline
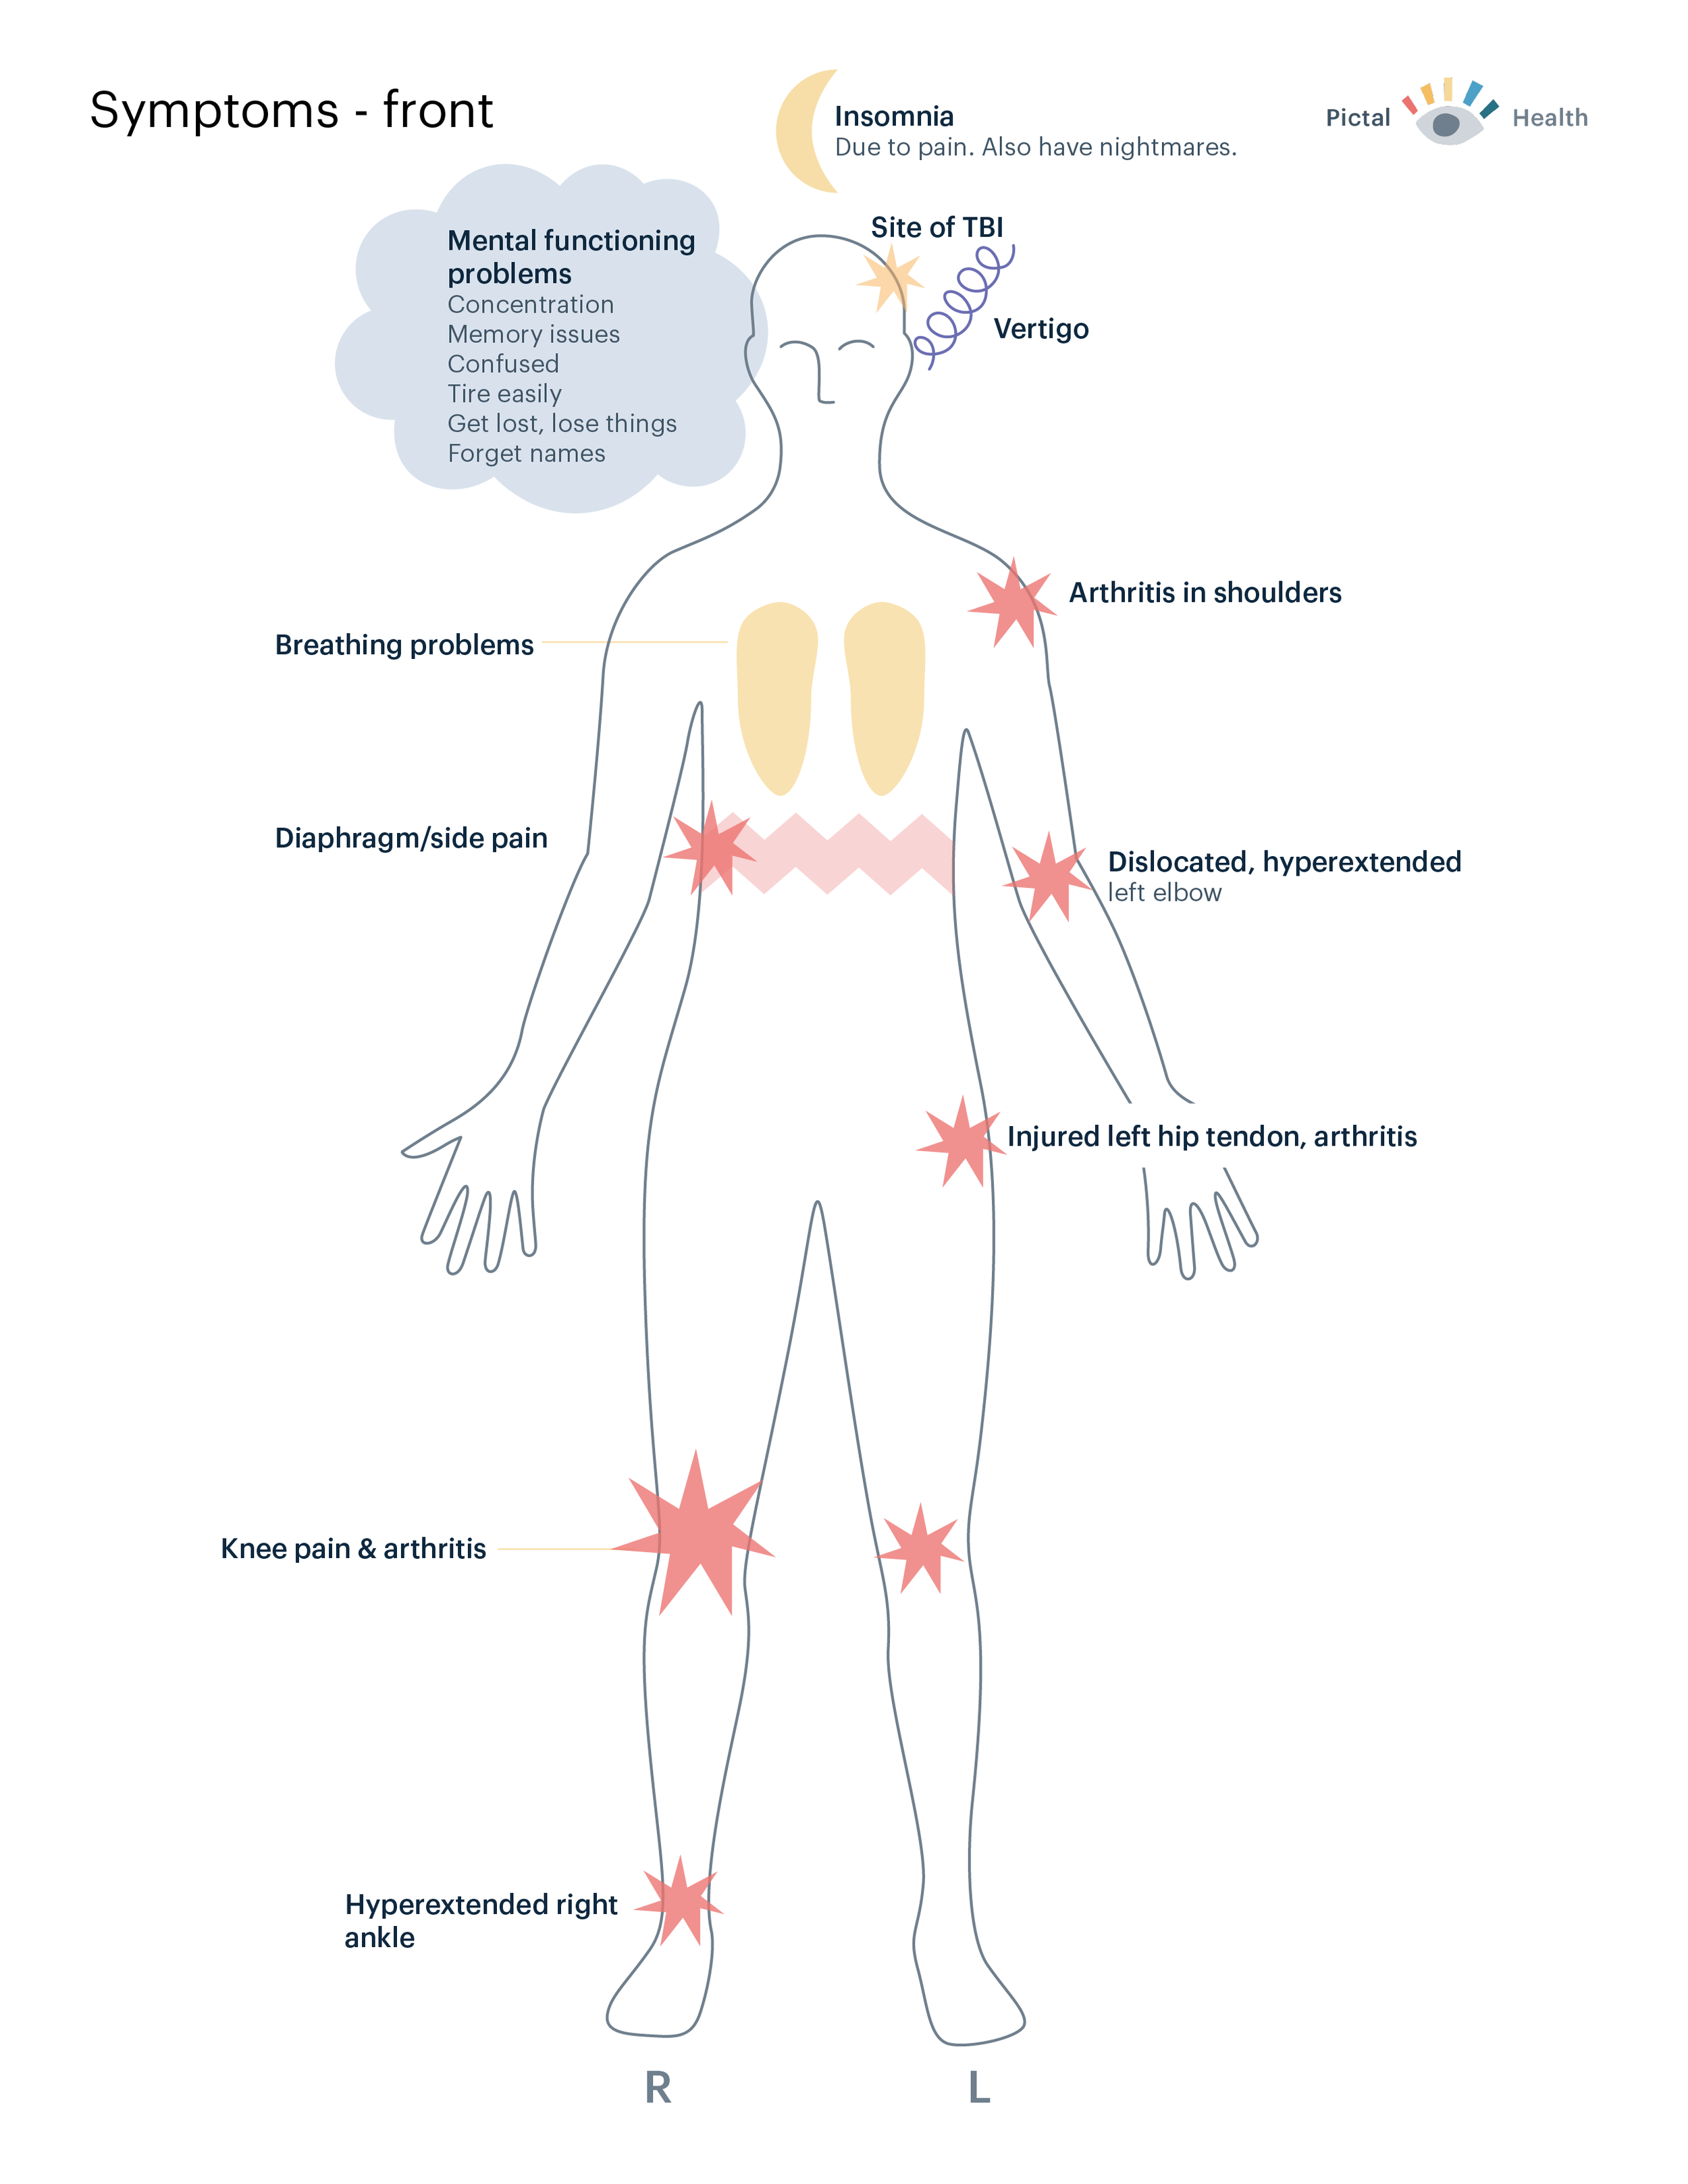
I also created symptom maps for many of the veterans
The feedback was very positive from both veterans and the doctor involved in the pilot.
“[this] approach helped me to explore and connect impactful and meaningful events of my service, life and healthcare in ways that brought greater meaning and clarity to the breadth and depth of my complex chronic conditions and life events.”
– Veteran“This visual health timeline was extraordinary. It really put in perspective all of the medical/psychosocial issues of patient and allowed me to fully appreciate how they intersect.”
– Doctor
Part 2: The Product
Why create a digital product? I heard a few key things from my patient clients, along the way:
they want to update their timelines themselves
they needed a lower-cost solution
printing their timeline was a pain point; it would be easier to transmit digitally
I had been thinking a digital health history product since about 2012; by starting and learning from the service offering, I validated the concept and gained important insights that fed into design.
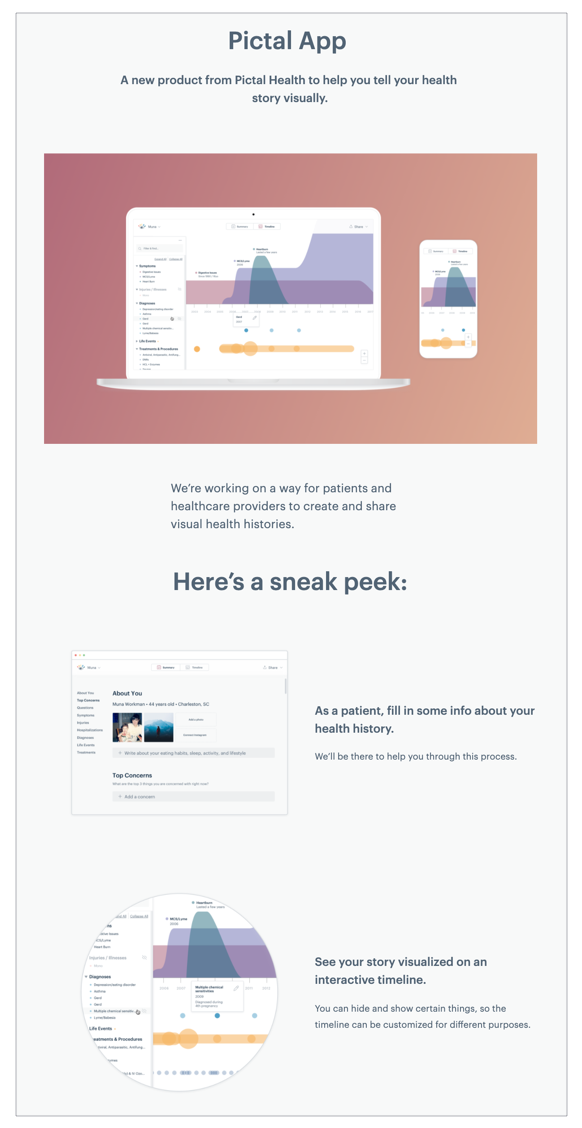
Concept landing page & survey to test demand
To start to gauge interest and get feedback on this idea, we created a landing page that highlighted key features of Pictal App; it also linked to a Typeform survey, which got over 100 responses. 88% of respondents said they would want to use the application; many were concerned about cost and information security. Great additional validation and insight.
Personas
Based on the results of user research and my initial client work, I put together key personas for patients and clinicians.

Design Principles
I love using design principles to stay on track and guide an application’s design and development. Using what I learned from many interviews and client interactions, I created a set of design principles for the Pictal App; here are a few from my product requirements document:

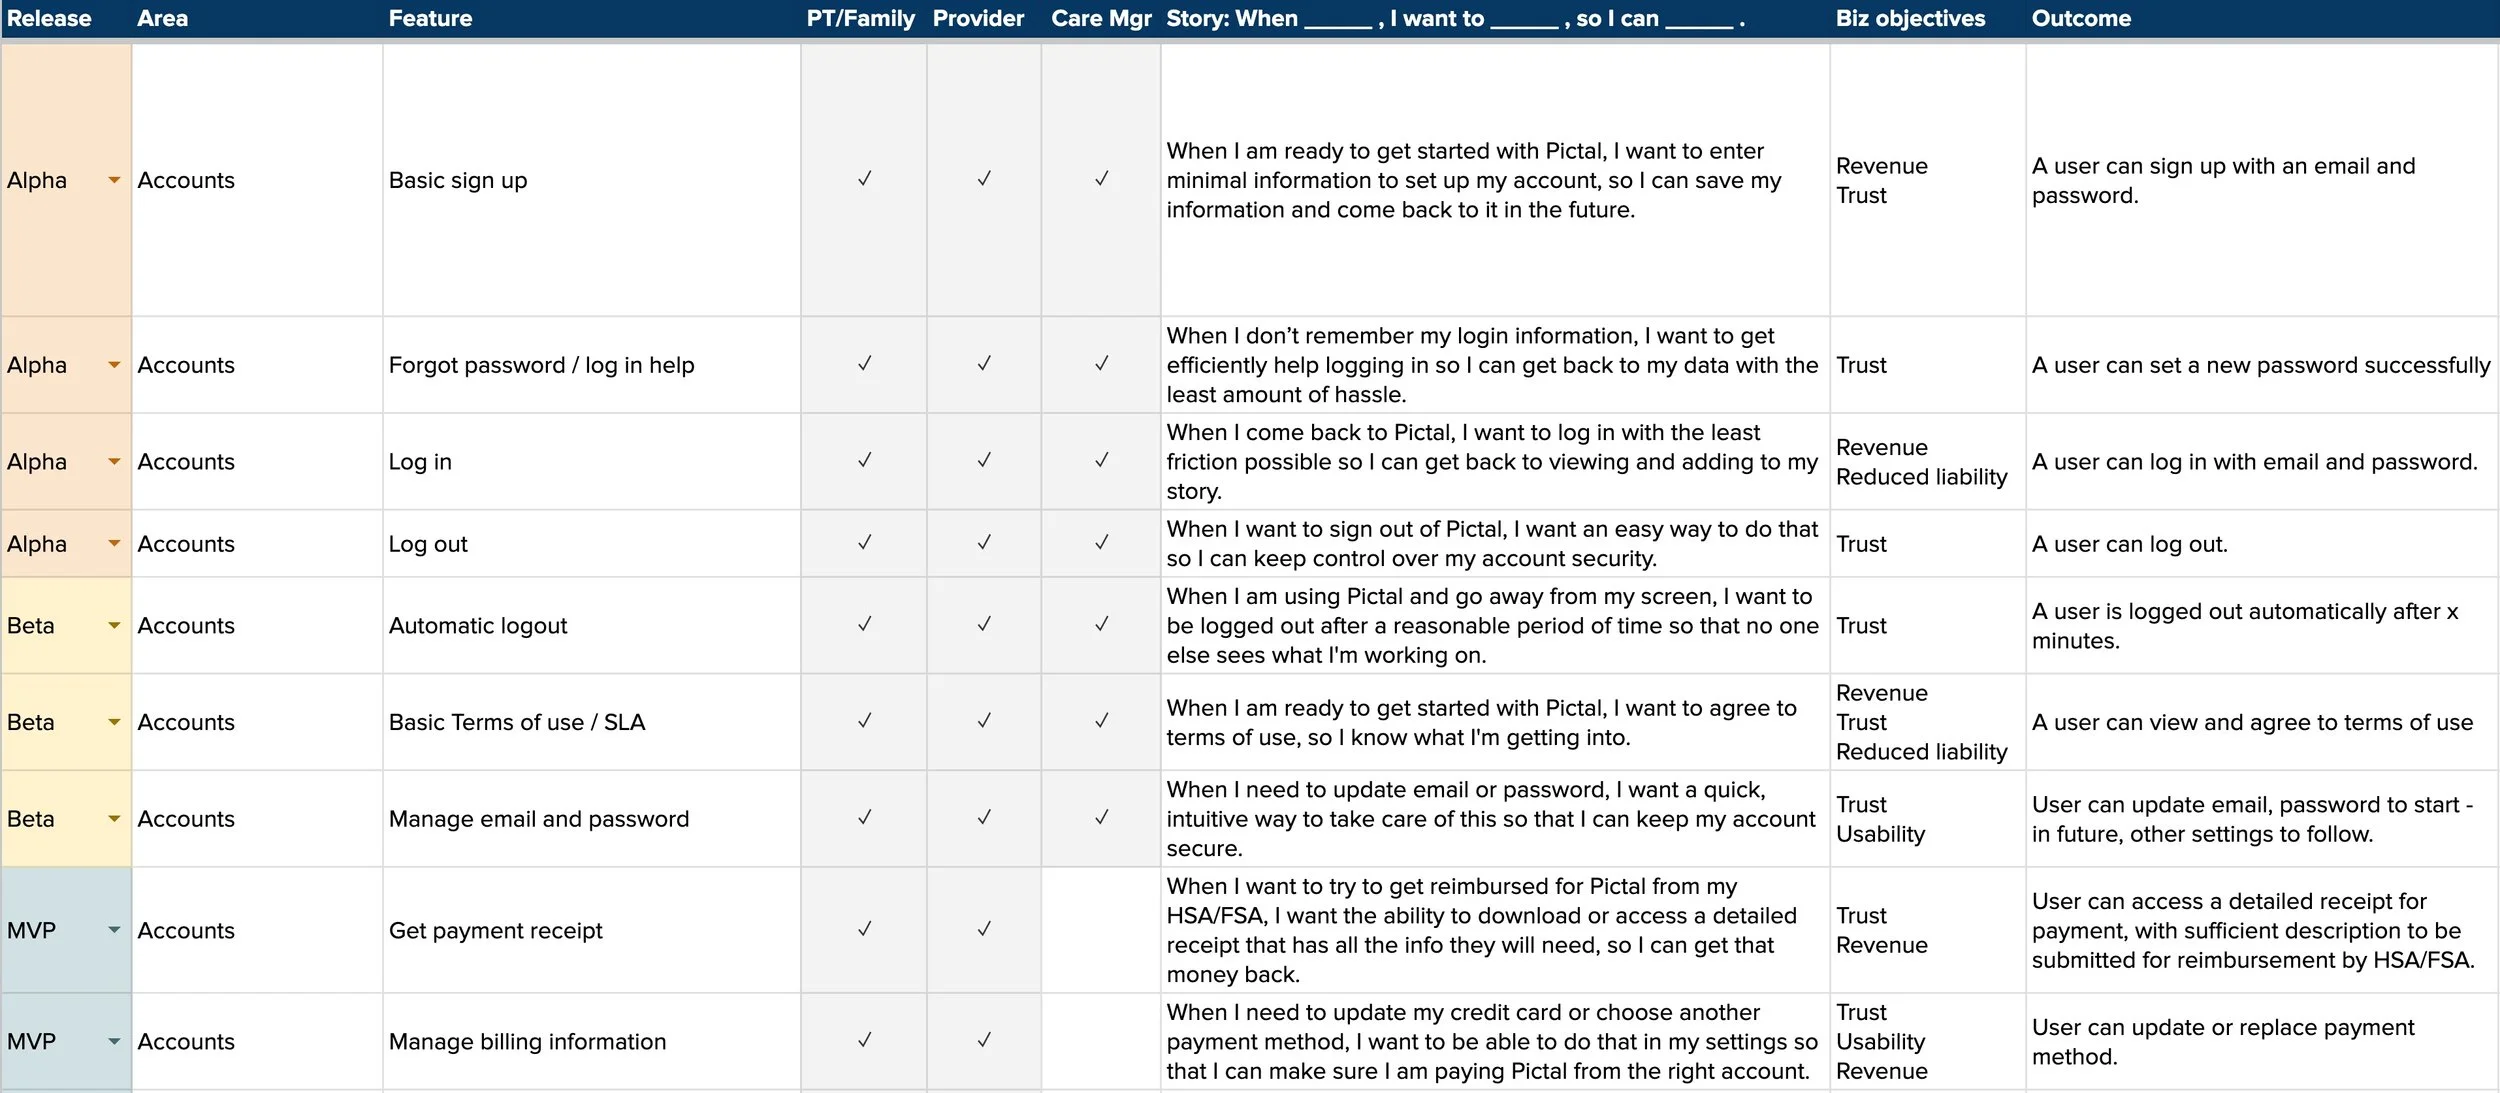
Product requirements & stories
I put together and still maintain an extensive document outlining product requirements, including detailed user stories for each feature, mapped to business objectives and potential product releases.
Product roadmap
I also put together a simple document to illustrate and think through the different phases of the Pictal App. I started with 5 distinct phases/releases - here’s a preview:

Data mapping
I documented the data points that the app needed to account for, and I put together a basic model to show which data points might need to connect to each other.

Task Flows
To help visualize and account for the application’s logic, I put together task flows for complex processes like onboarding.

Interface sketching
I’ve created a stack of paper sketches that have helped me work through the navigation, detailed design and logic for the application. I’m a huge believer in starting on paper, and this has helped me more efficiently move into digital design and prototyping.

Just a few of the many pieces of paper I’ve filled.
Interaction design, prototyping and testing
I’ve extensively prototyped our app using Figma. The prototype has been invaluable for getting feedback from at least 50 patients, healthcare providers, and potential customers.
The main health timeline screen of our app
Prototyping how symptom graph creation might work
Technology vendor procurement
I worked with Ron Herman from TeamFound to conduct an RFP process to get estimates and select potential vendors to create the application. I also conducted a separate RFP myself, and got additional proposals from a few vendors that have more experience with health data. Due to lack of funds, developer and overall gem of a person Chris Zamierowski has continued to work on our technology alone.
Result - a financially self-sustaining web app
Here’s a screenshot of our development environment - always a work-in-progress, but a very stable app, thanks to Chris.
We launched launched our MVP in Spring 2024, and we’ve had over 150 users so far, the majority of them paid customers.
Today, Chris and I continue to work through the design and development of our web app. I track bugs, note feature requests, and prioritize work that will help us make the most impact with our limited resources.
Part 3: The Business
A company is much more than a well-designed product; it also has to be a viable business. Here are some activities I undertook to imagine and refine the business model.
Customer mapping & discovery
The business of healthcare is very complicated. I put together this stakeholder map to try to visualize the different potential customers for Pictal Health:
I also put together many business model canvases. Here’s one:

But I wasn’t satisfied with it; it didn’t give me an easy way of comparing customer segments. So I drew this matrix, using size to indicate positive or ‘good.’
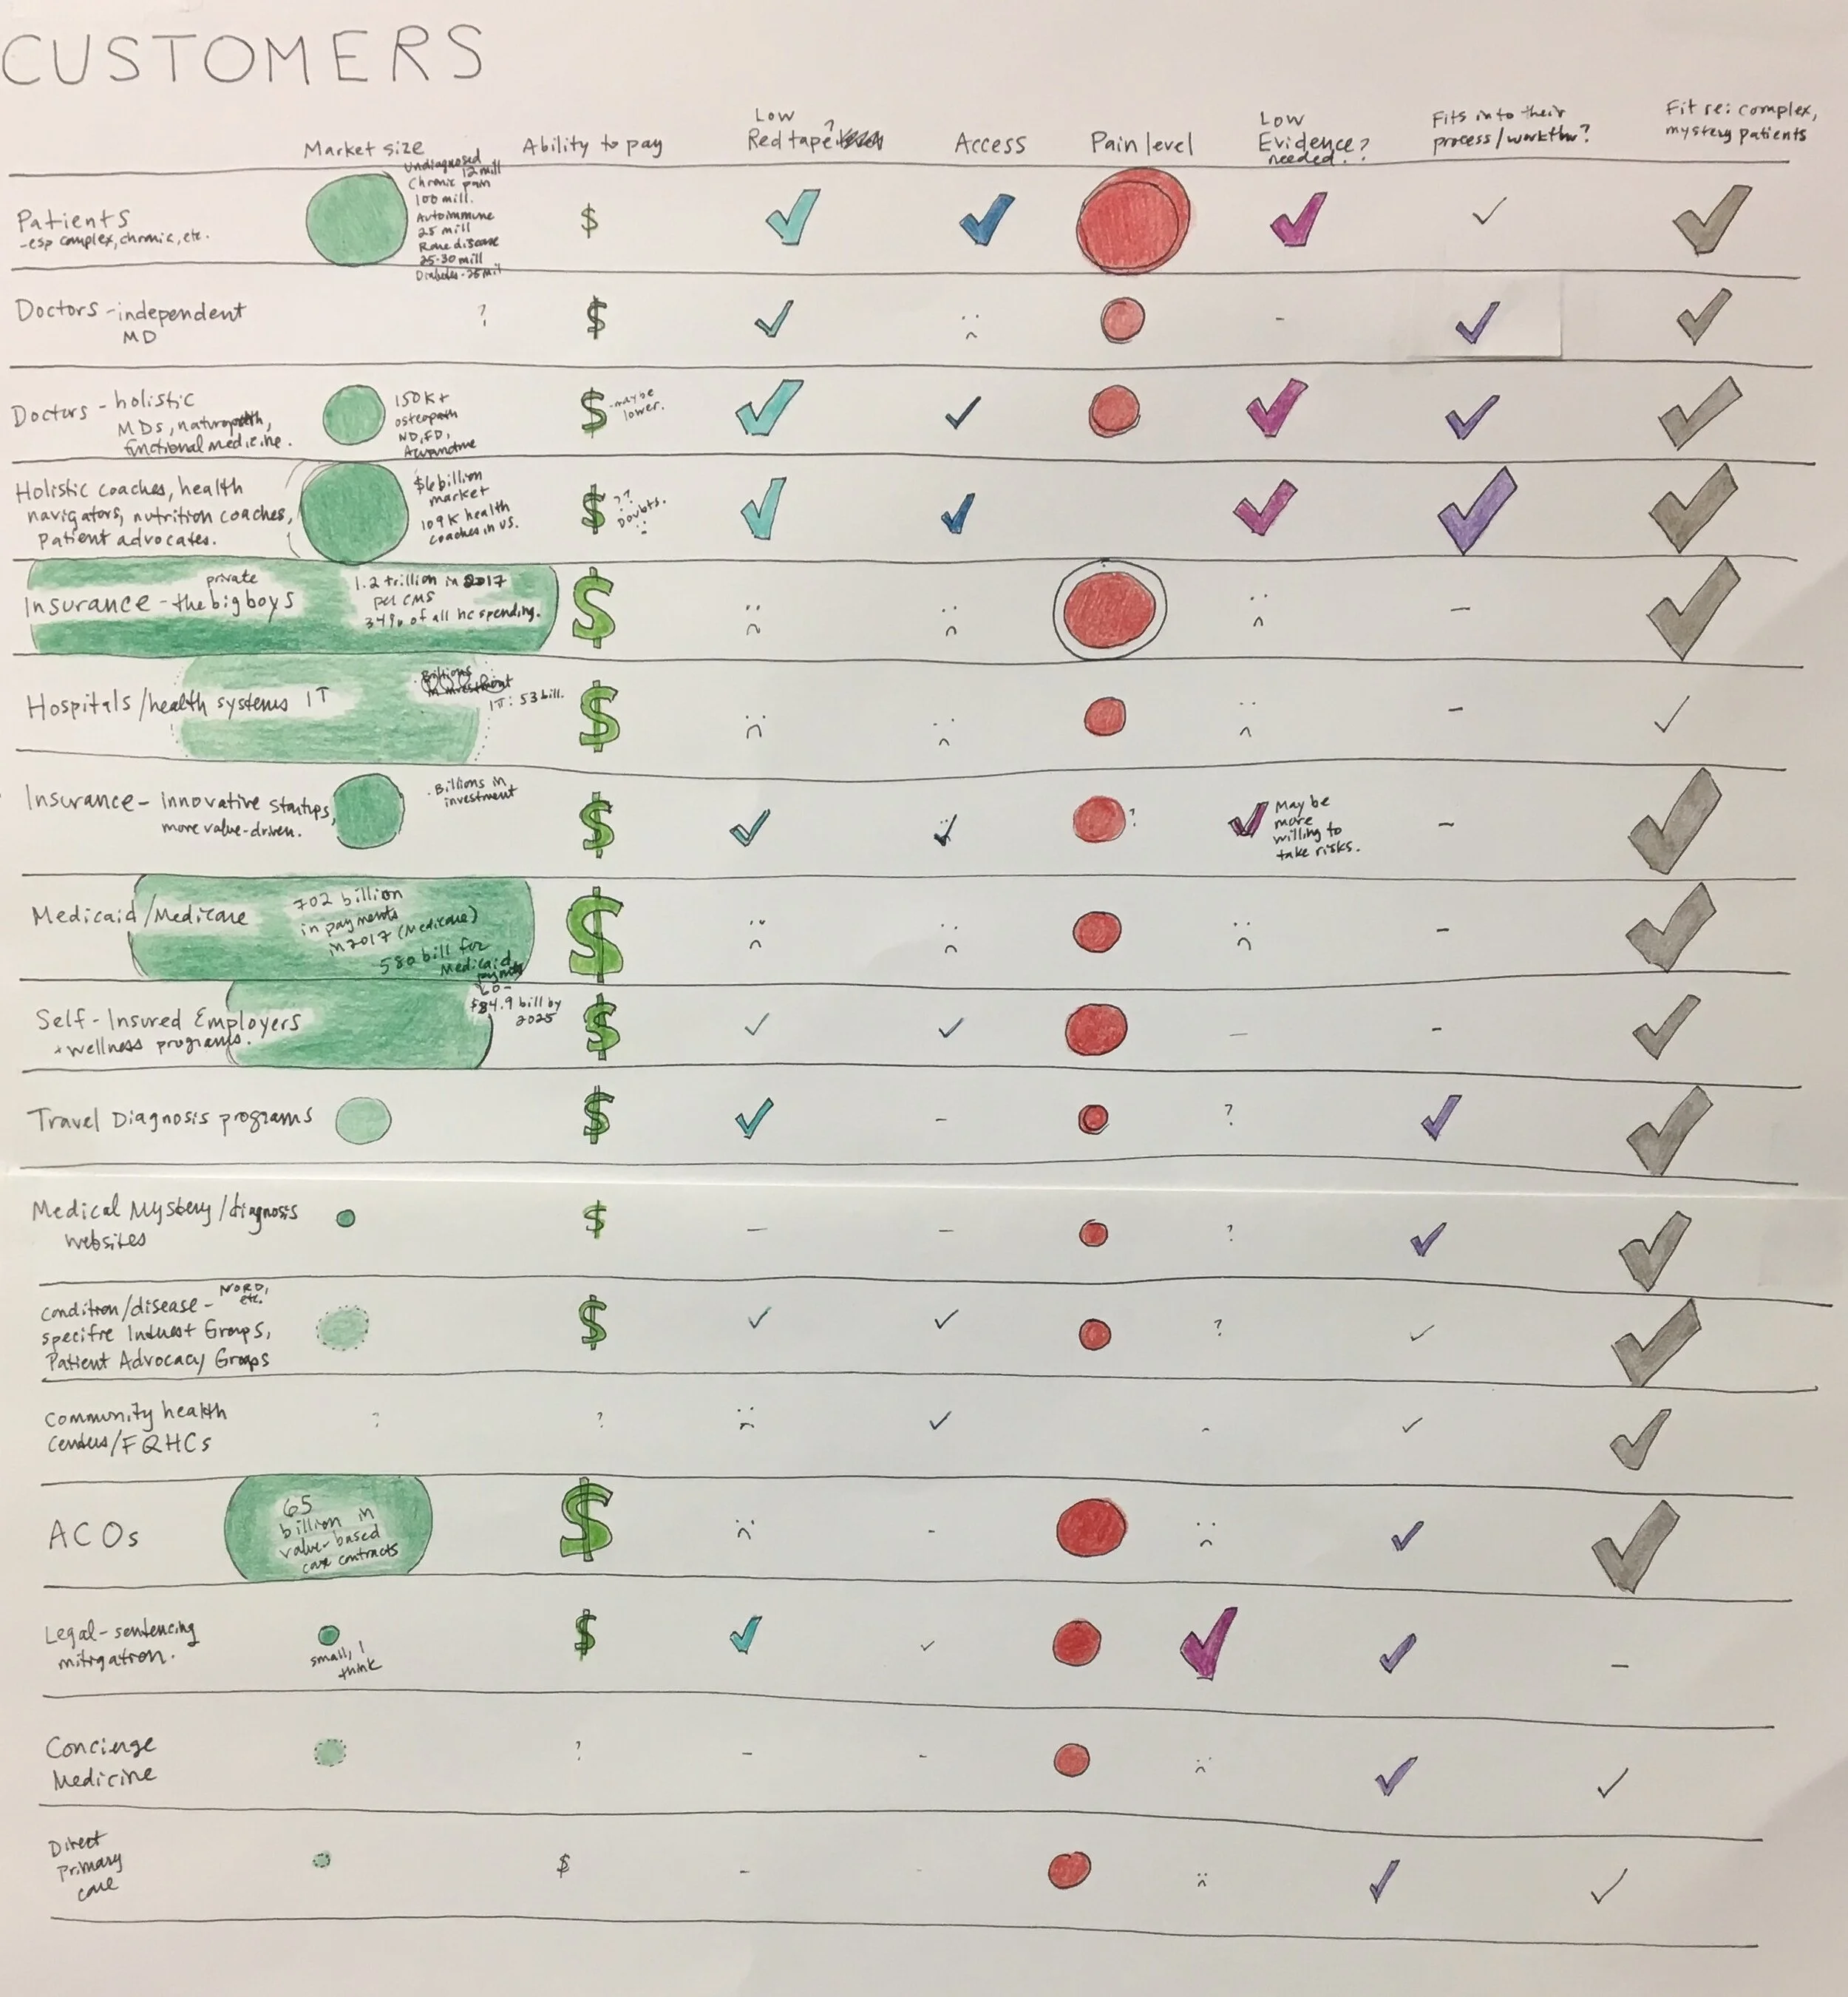
It’s ugly, but it helped. I could have refined it, but I didn’t really need to, since it was just for me. (This drawing is also featured in a popular post I wrote called Draw your problem.)
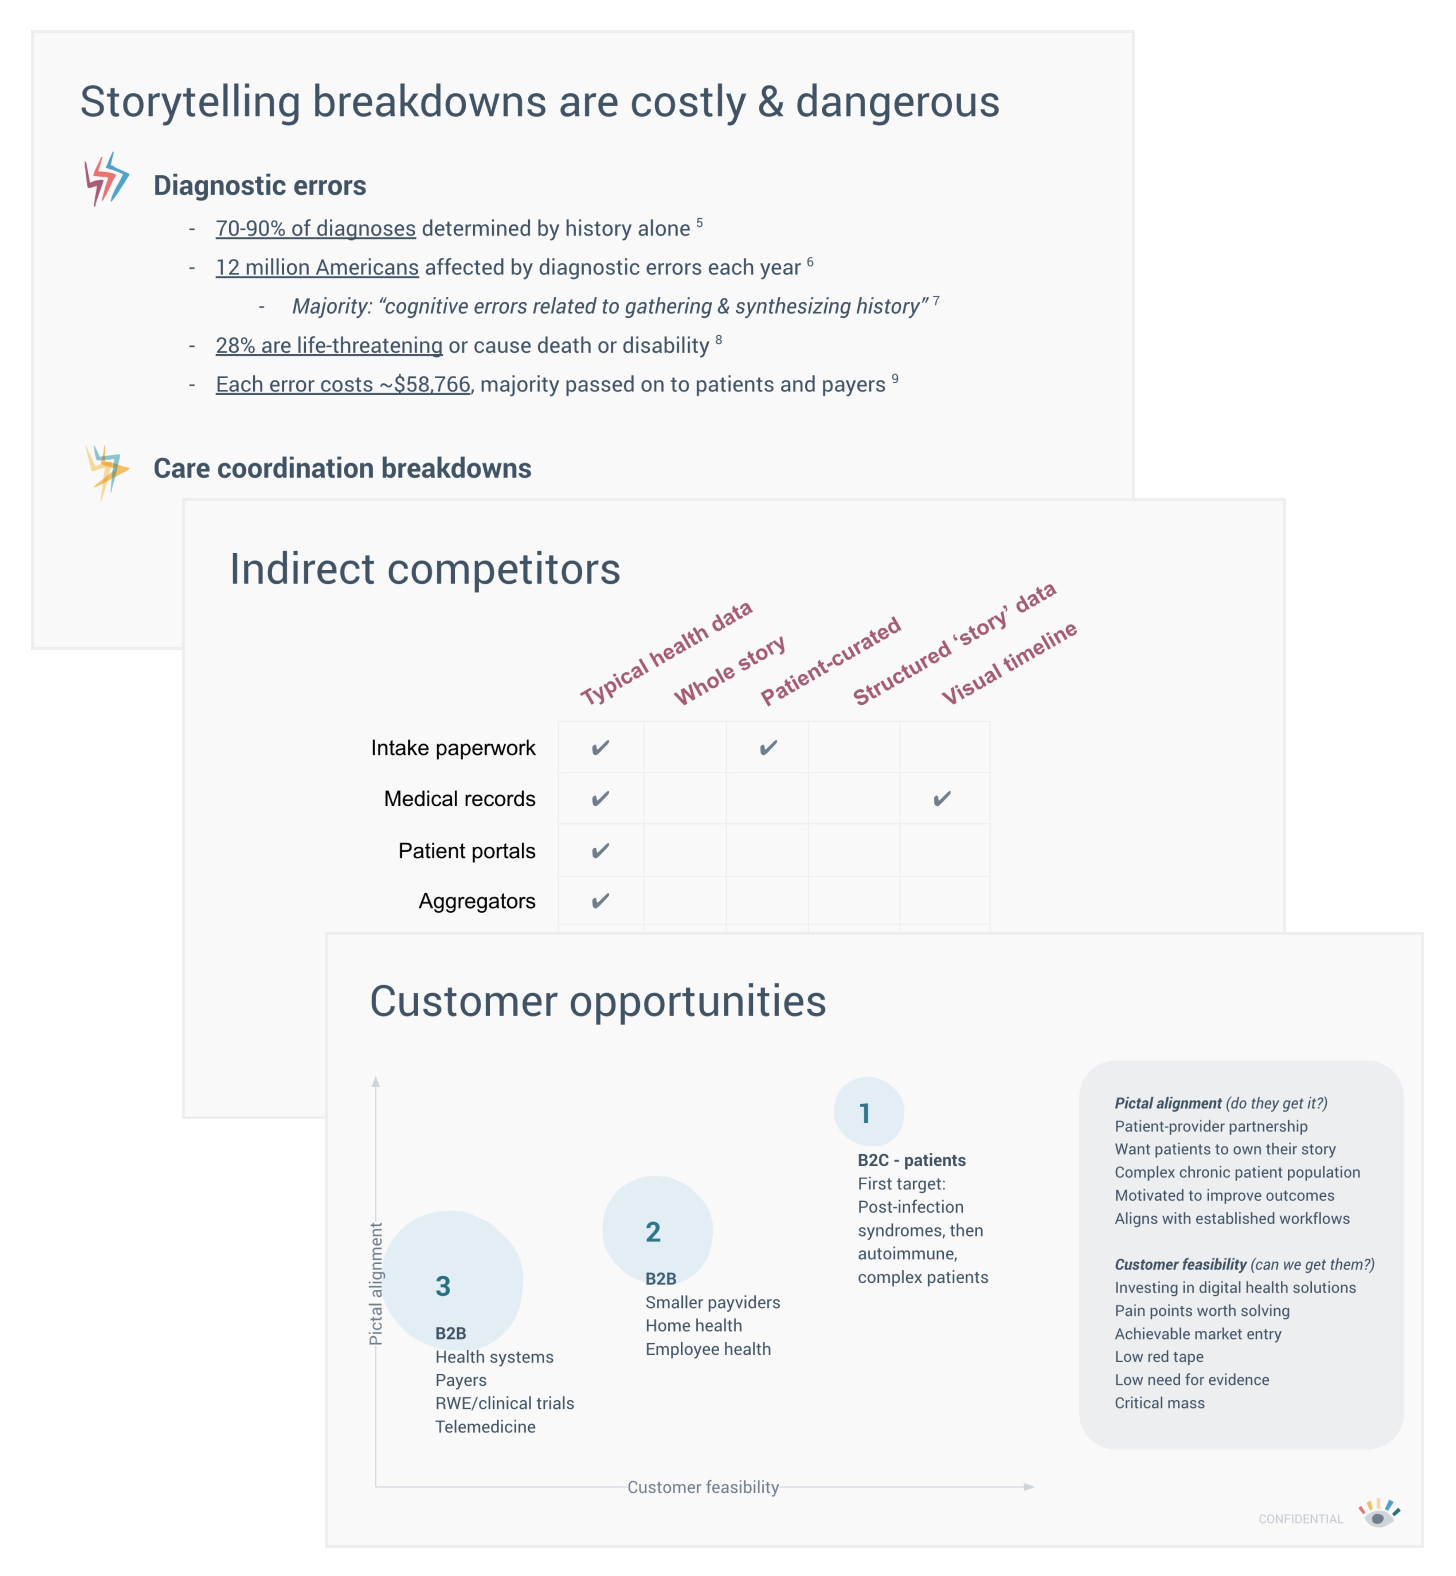
For us, it has been a long journey to try to understand what our ideal market should be. Below are some attributes of an ideal b2b beachhead market, mapped out. I spent quite a lot of time on this while part of the Mass Challenge accelerator in Fall 2022.

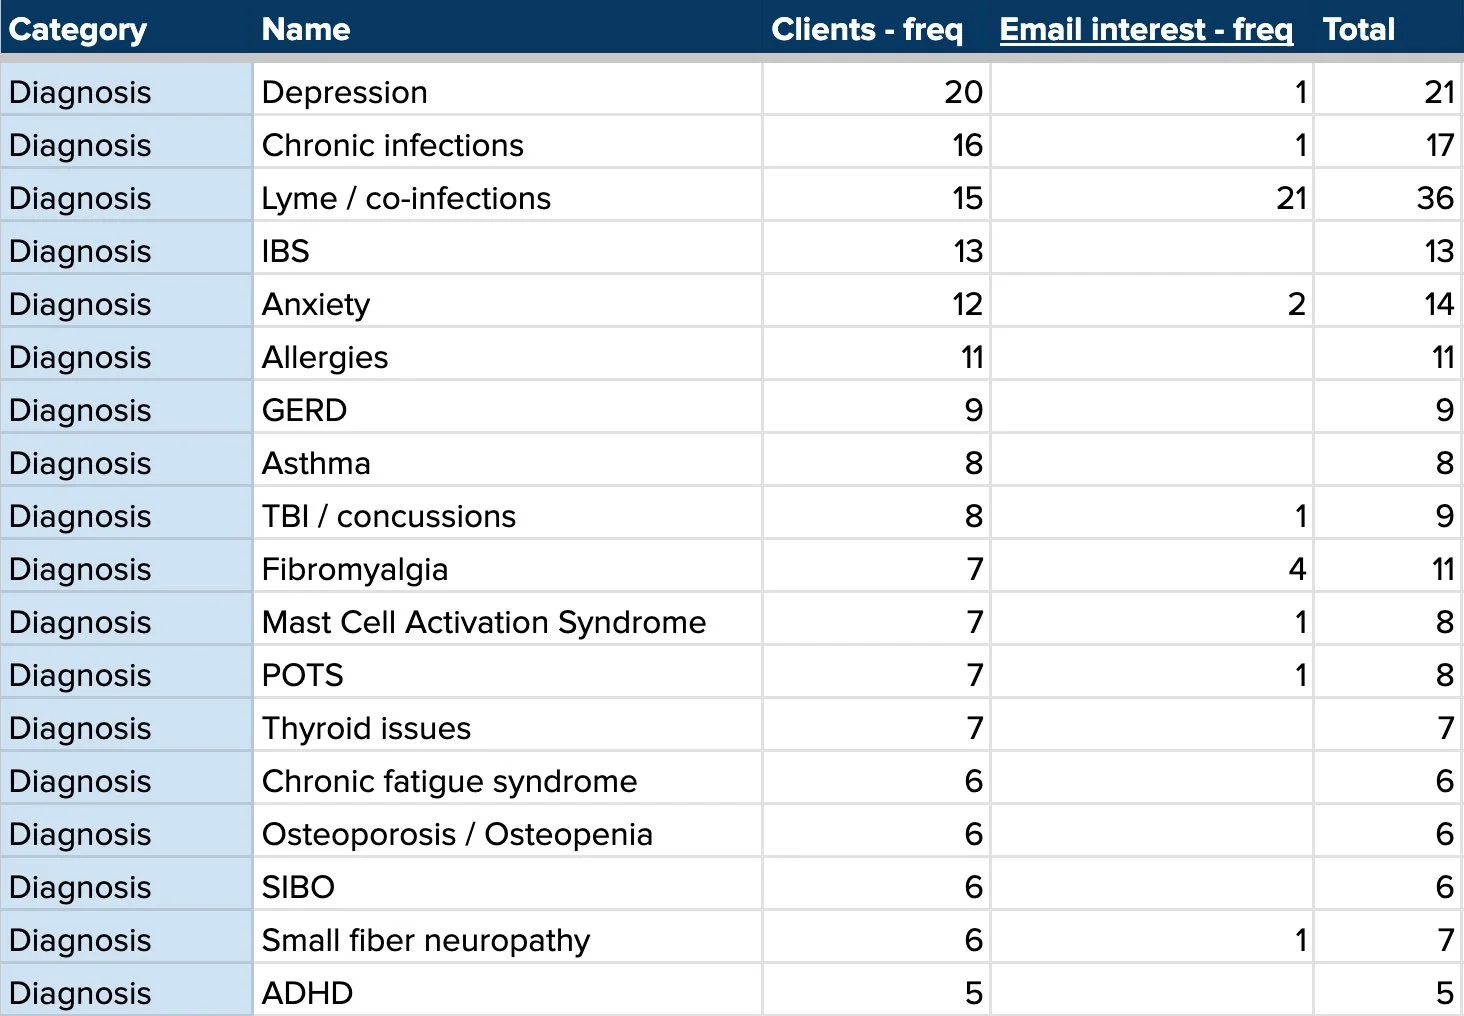
Who have our past customers been? I spent time manually coding various elements of the clients I had worked with thus far, and the results were illuminating. A clear mix of mental health, post-acute infection syndromes, and general immune system dysfunction, with a smattering of gut issues.
I also did many interviews with prospective customers: at least 20 health advocates and coaches (not a viable customer), 50+ patients (viable if I could bring the price down), many doctors (probably not a viable customer, especially those who work in large orgs,) a few folks from insurance companies (possibly viable if I can build enough evidence behind it), and various other startups and companies (how might it integrate with our services?) Quite a journey, and always in-process.
Startup Accelerators
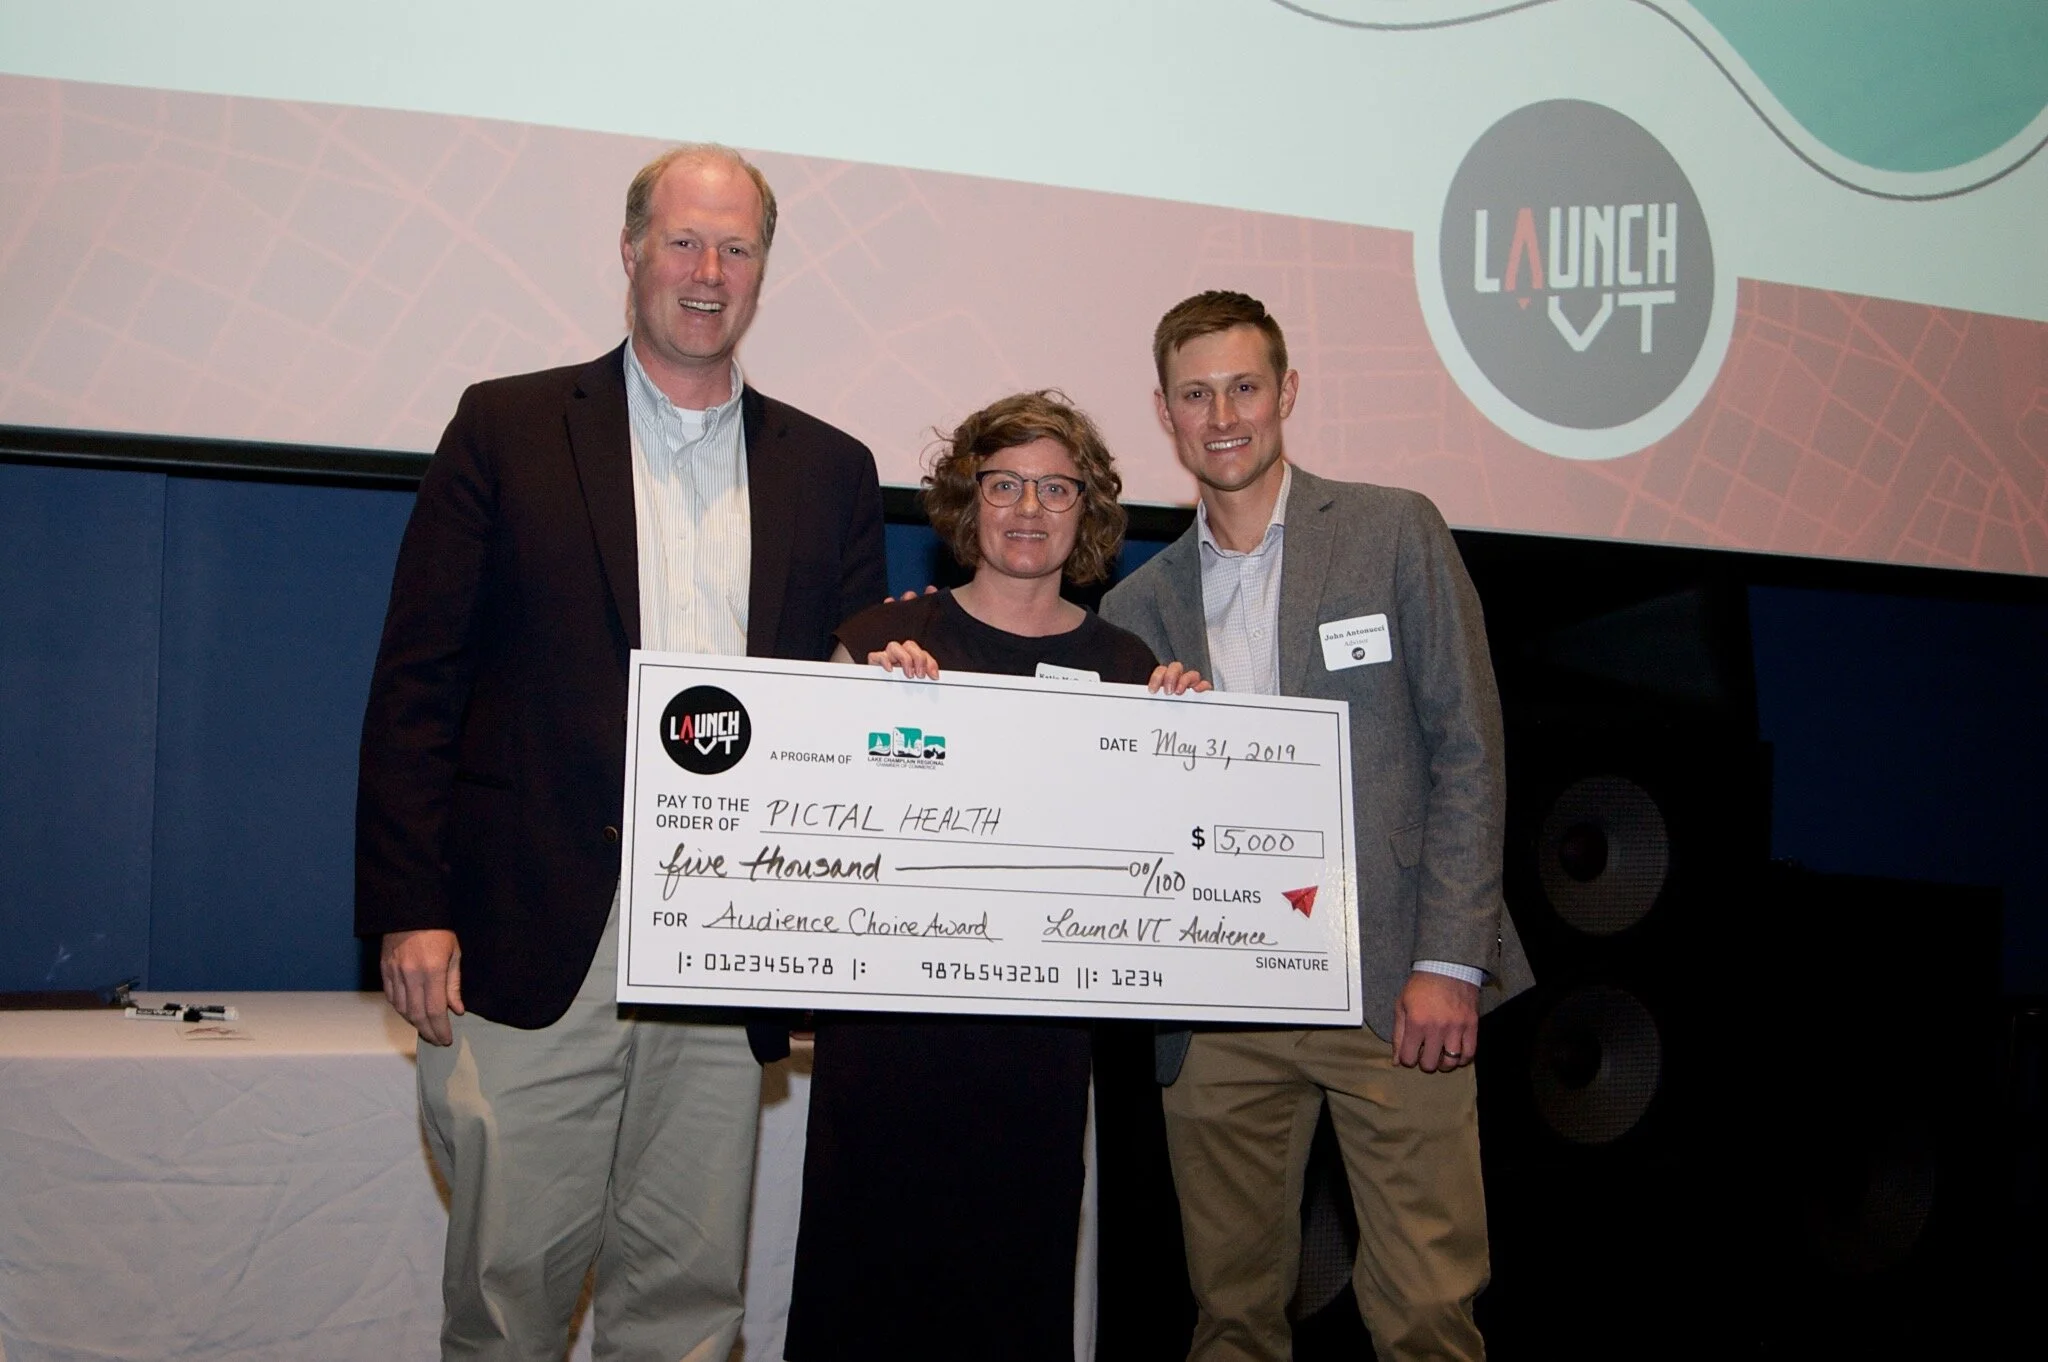
I took part in the LaunchVT accelerator program in spring 2019, and received mentoring, pitch preparation help, and many other benefits. At the pitch competition, Pictal Health won the people’s choice award and took home a novelty-sized check for $5,000. This was another signal that Pictal Health is serving an unmet need.
I was also accepted into the Mass Challenge early stage accelerator in the summer of 2022. It was a great experience; I attended many helpful sessions, and worked through more of my business strategy, financials, and fundraising strategy. I also met other healthcare startup founders that I still keep in touch with.
Pricing strategy
I sent a few surveys to my Pictal Health email list to understand more about how they think about pricing. I used some standard pricing questions to zero in on how they might value the product.
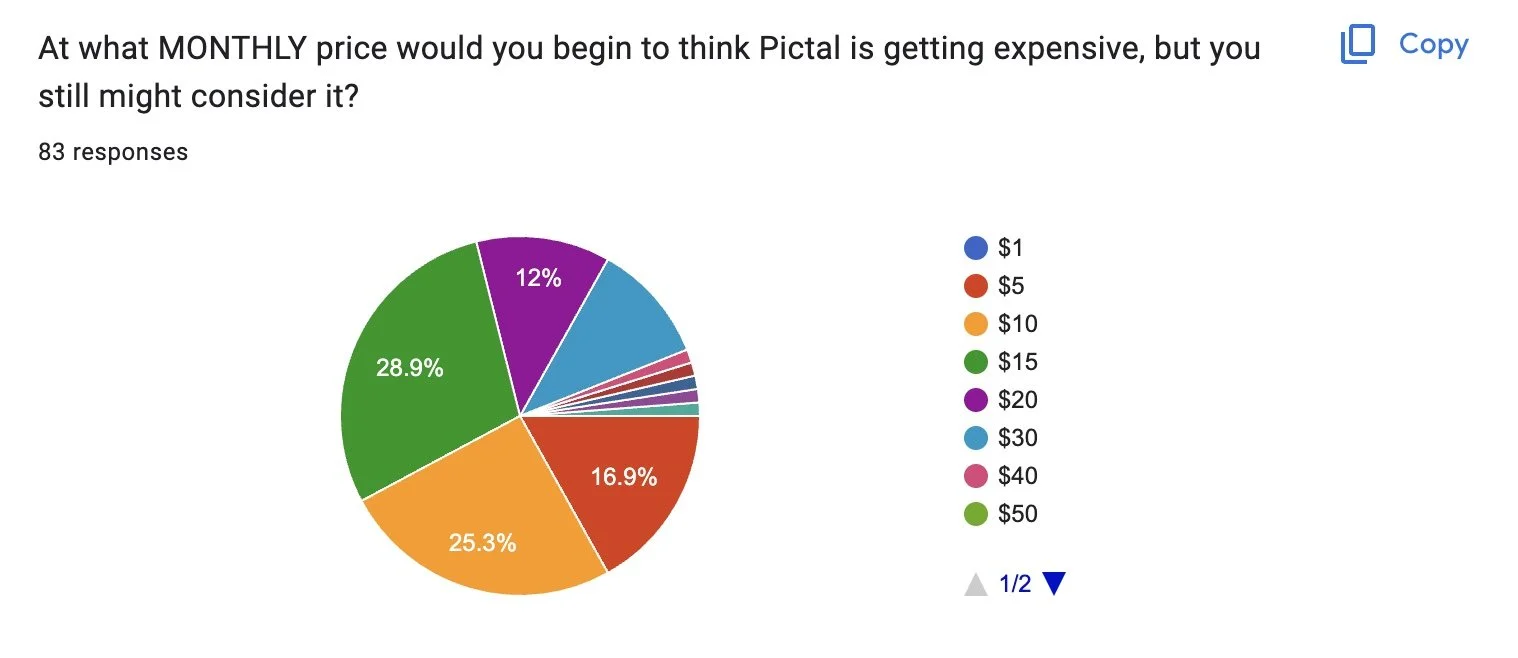
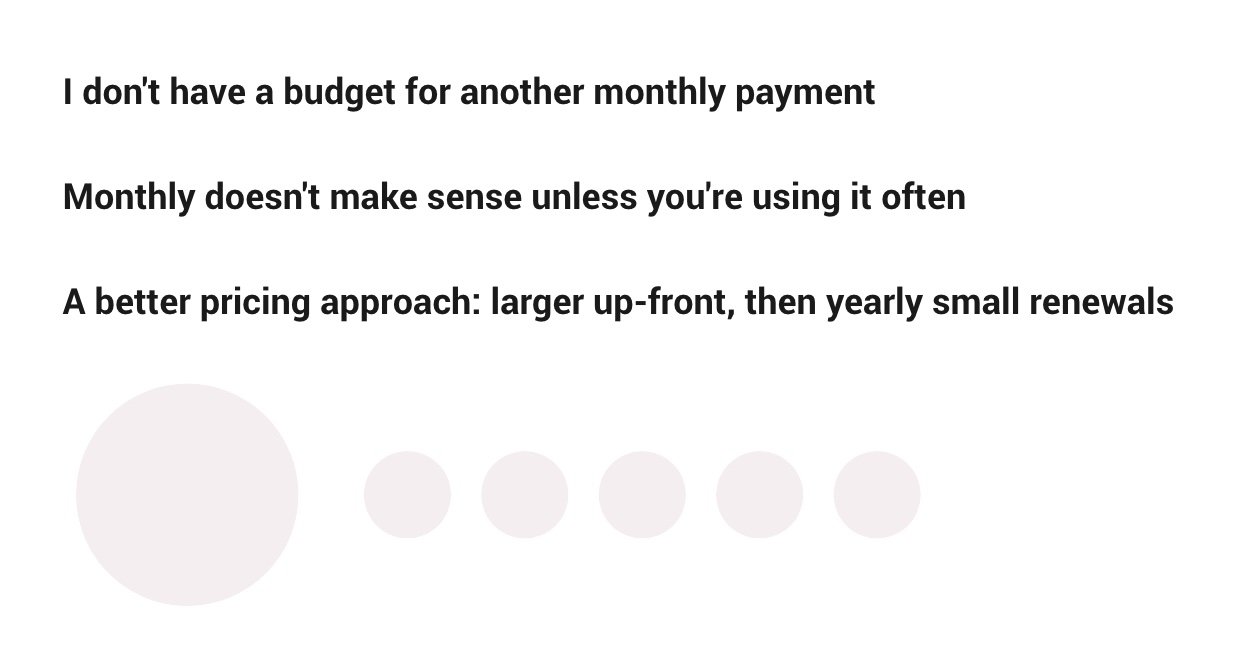
I learned a lot from this survey - especially from the open-ended responses, which helped me understand a payment structure that would be reasonable for this audience.
Key pricing insights:
Financial Projections
Throughout the process of participating in accelerators and prepping for fundraising, I created multiple versions of a detailed pro forma. I enjoyed it more than I expected.

Fundraising Deck
I prepared a business case and a deck to bring it to life. I have not yet raised money for Pictal Health, but it’s possible in the future.
Where is the business now?
The product is still available and is basically self-sustaining, and we have lots of ideas for where the business could go. We remain committed to helping patients be heard and seen, and we’re figuring out how to bring that forward into this age of AI and technology acceleration.